



LineWorks STARGATE

Quality KPIs reporting system for SPC charts.

Master SPC Control with Quality KPIs Reporting Across Multiple Factories

LineWorks STARGATE rises to the occasion with advanced statistical reporting and analysis capabilities, simplifying and optimizing your quality control processes. With thousands of SPC charts running on LineWorks SPACE across various production fabs, LineWorks STARGATE enhances efficiency by managing different chart definitions effortlessly. It delivers real-time visibility into key quality metrics of Key Performance Indicators (KPIs), ensuring your processes consistently meet the highest standards.

contact-placeholder
We’re here to help you achieve manufacturing excellence. Contact camLine

Trusted by Leading Manufacturers Worldwide


Logos_GlobalFoundries
Logos_infineon
Logos_XFAB
Logos_soitec
Logos_ams-20250829-092441 (1)
Logos_skyworks
Logos_nxp
Logos_azur space-20250829-092549 (1)
Logos_stmicroelectronics
Logos_continental

Key Challenges in Managing a Large-Scale SPC Environment


Manufacturers face increasing complexity managing thousands of SPC control charts across multiple production sites. Challenges include:

  • Handling parameter-specific chart definitions with diverse limit rules.
  • Tracking changes to limits and rules over time for each chart.
  • Addressing violations for every chart
  • Comparing limits across fabs.
  • Detecting matching issue between process or metrology tools.

How LineWorks STARGATE Ensures Manufacturing Excellence

Core Features


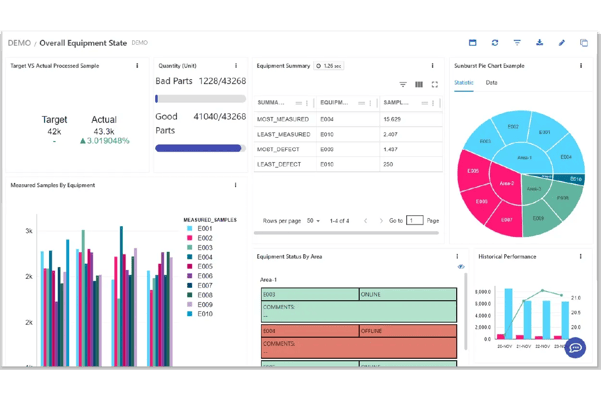
A dashboard from LineWorks STARGATE showing an overview of equipment performance. The interface includes target vs. actual sample analysis, good vs. bad parts tracking, sunburst pie chart visualization, historical performance trends, and equipment status indicators.

  • LineWorks STARGATE provides a broad range of built-in KPIs, while also enabling users to effortlessly define additional mission-critical KPIs. Its evaluation engine is highly accurate and thoroughly proven, consistently delivering precise and reliable results.

  • LineWorks STARGATE features an intuitive navigation system that empowers users to efficiently filter the data and drill down into reports, providing essential insights for decision-making and enhancing quality control.

  • A key feature of LineWorks STARGATE is its ability to aggregate and evaluate reports from multiple production sites. This enables users to monitor large-scale operations, detect discrepancies, and standardize processes across facilities.

  • LineWorks STARGATE features a flexible reporting framework that enables users to create diverse reports, with charts that can be customizable to meet specific needs. Additionally, the interactive reporting capabilities make data analysis quick and easy for users.

Advanced Reporting Capabilities


Dynamic Report Tool

Easily visualize complex data through customizable charts and drill-down navigation for quick issue identification. This feature includes:

  • Customizable Charts: Tailor your charts to meet specific definitions with custom limit rules, ensuring that the displayed data is relevant and easy to interpret. Users can adjust chart parameters to focus on key metrics and trends that matter most.
  • Drill-Down Navigation: Navigate seamlessly from high-level summaries to detailed control charts. With a simple click, users can move from an overview of quality KPIs down to specific SPC charts in LineWorks SPACE, making it easier to investigate and resolve quality issues quickly.  

Flexible Report Engine

Advanced options to create diverse reports that fulfils specific quality objectives.

  • Sample-Level Reporting: Evaluate using sample level data, offering flexible aggregation and calculation options.
  • User-Defined KPIs or Formulas: Effortlessly define additional mission-critical KPIs to adapt to evolving quality requirements.
  • Capability and Stability Evaluation: Easily assess Process Capability (Cpk) and Stability (%OOC) to stay informed about the current quality status.
  • Control Limit Quality Check: Identify charts with improper control limits to ensure a precise and consistent SPACE control limits checks.
  • Matching Analysis: Detect matching issue between process or metrology tools to ensure consistent process.
  • Maturity Evaluation: Evaluate charts maturity to ensure standardized and continuous improvement in quality control.
Integration

Seamlessly Integrated with Advanced SPC

LineWorks STARGATE is seamlessly integrated with LineWorks SPACE, camLine’s real-time SPC management platform. Users can drill down from STARGATE reports directly to SPACE charts, providing fast access to the root cause of problems.

A series of SPC reports in LineWorks STARGATE, displaying trend charts, data tables, and statistical process control (SPC) visualizations. The image highlights the drill-down capability from summarized quality data to detailed SPC charts for in-depth analysis.
camLine
Leading global supplier of MES/MOM solution

LineWorks STARGATE delivers advanced trend analysis and reporting, enabling KPI tracking across multiple sites, including SPC management, violation summaries, maturity evaluation, control limit checks, tool matching, and process performance with detailed drill-down capabilities.

Frequently Asked Questions

FAQ


Comparing SPC performance across sites

    • LineWorks STARGATE aggregates and evaluates the wider chart population for enterprise reporting, quality KPIs, capability and stability, control-limit quality, tool matching, chart maturity, and cross-site comparison. Users can drill from a STARGATE report into the relevant SPACE chart for detailed investigation.
    • LineWorks SPACE performs real-time SPC evaluation and supports reactions at the control-chart level.
  • LineWorks STARGATE converts chart populations and sample-level data into filterable KPI reports. Quality teams can identify which processes, tools, charts, or sites require attention without reviewing every control chart individually. The reporting hierarchy supports drill-down from enterprise summaries to detailed reports and the underlying LineWorks SPACE chart.

  • Yes. LineWorks STARGATE can aggregate and evaluate reports from multiple production sites so users can compare processes, tools, chart definitions, limits, and quality KPIs. Cross-site comparison is most useful when shared definitions are governed consistently. The organization should define global versus local KPIs, limit ownership, site mapping, and the escalation path for discrepancies.

  • Users can start with a high-level STARGATE KPI, filter or navigate to the affected report detail, and open the corresponding control chart in LineWorks SPACE. This shortens the path from enterprise quality status to the process context, measurements, limits, violations, and history required for investigation. Access rights and identifiers must remain aligned across the two products.

Investigating quality problems

  • LineWorks STARGATE supports built-in and user-defined quality KPIs, sample-level reporting, capability and stability evaluation such as Cpk and out-of-control percentage, control-limit quality checks, process or metrology tool matching, chart maturity evaluation, and violation summaries. KPI formulas, thresholds, aggregation, and comparison context should be reviewed by the SPC owner.
  • Yes. LineWorks STARGATE supports user-defined KPIs and formulas in addition to built-in evaluations. A custom calculation should have a documented definition, owner, input population, aggregation, thresholds, version history, and validation method. This is especially important when the KPI is compared across sites or used to prioritize corrective action.

  • Control-limit quality checks highlight charts whose limits may be unsuitable or inconsistent. Matching analysis compares process or metrology tools to identify differences that may affect consistency. These evaluations prioritize engineering review; they do not replace investigation of the measurement system, process context, sampling, maintenance state, and applicable SPC method.

Planning enterprise deployment

  • Define the LineWorks SPACE sources, chart and context mappings, KPI formulas, site hierarchy, access permissions, data refresh, drill-down identifiers, global and local governance, and report ownership. Validate calculations on representative chart populations before enterprise rollout. The project should also define how discrepancies are assigned, investigated, corrected, and verified across sites.

  • LineWorks STARGATE is relevant to multi-line or multi-site high-tech manufacturers that use LineWorks SPACE and need enterprise SPC reporting. Applications can include semiconductor, solar PV, battery, electronics, medical-device, and advanced-material manufacturing. Fit depends on the SPACE deployment, chart scale, shared KPI definitions, site comparability, and the organization’s SPC governance model.

Industry Insights and Customer Stories

Explore our resource library to discover how camLine supports high-tech manufacturers in enhancing quality, efficiency, and reliability.

Let’s Discuss Solutions with camLine's Experts

Our team is ready to deliver tailored MES solutions that streamline your production, improve product quality, and maximize efficiency across your operations. Tap into camLine’s decades of expertise in digital transformation to overcome your manufacturing challenges.